Assessing the Image
Before starting work on any image, you should use the probe to assess which areas of the image correspond to the brightness ranges in the histogram. Look for histogram features to aid identification.
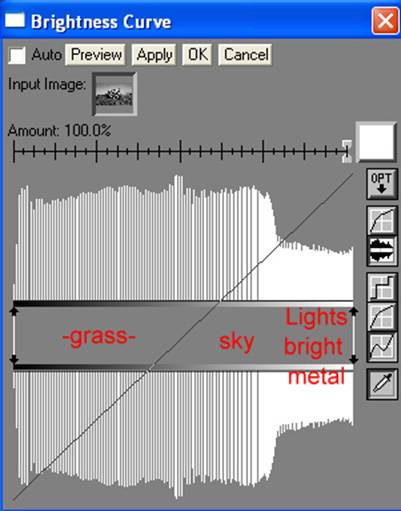
Open the monochrome (b&w) image and select the grey brightness curve transform. After selecting histogram view and high histogram expansion, examine the histogram. Use the probe to identify which parts of the histogram relate to the different parts of the image. You will see that the bright parts of the bike, especially the headlamps, forks and chrome are in the rightmost part of the histogram, ranging from roughly 75-100. There is a very convenient step in this histogram, roughly marking the end of the sky’s tonal range and the start of the bright metal parts of the bike. The sky is in the 45-75 range, the start if this is just below the small peak in the centre of the histogram. The grass ranges from about 20-40. The range on the bike is from 0 to 100. These overlaps we can exploit whilst using the effect. You will also notice that there is a degree of posterisation already from image adjustments in 8 bit mode, shown by the gaps between the bars in the histogram. Posterisation can help or hinder the image, depending on what you’re trying to do. In general it is a bonus.
A similar process is carried out using the colour curves transform for each channel when applying the effect to colour images.